The introduction. Frames the workshop as practical: how to make money work for you, not how to think about money academically.
How to make money work for you
The presentation as delivered, slide by slide, with a synthesized takeaway for each. For deeper treatment of any topic, follow the links at the top of the page.
Overview
Click any thumbnail to jump to it below. Seven slides marked KEY are the load-bearing anchors of the talk — if time is short, read those seven and the Meta case study (slides 36–44).
Section A · Slides 1–7
The compounding math, walked through with an attendee named Steven as the running example. The threshold the slides establish: ordinary index returns aren't enough to retire early without depletion risk — and a single bad year almost breaks the plan. See the Retirement page for the interactive version of this math.
The introduction. Frames the workshop as practical: how to make money work for you, not how to think about money academically.
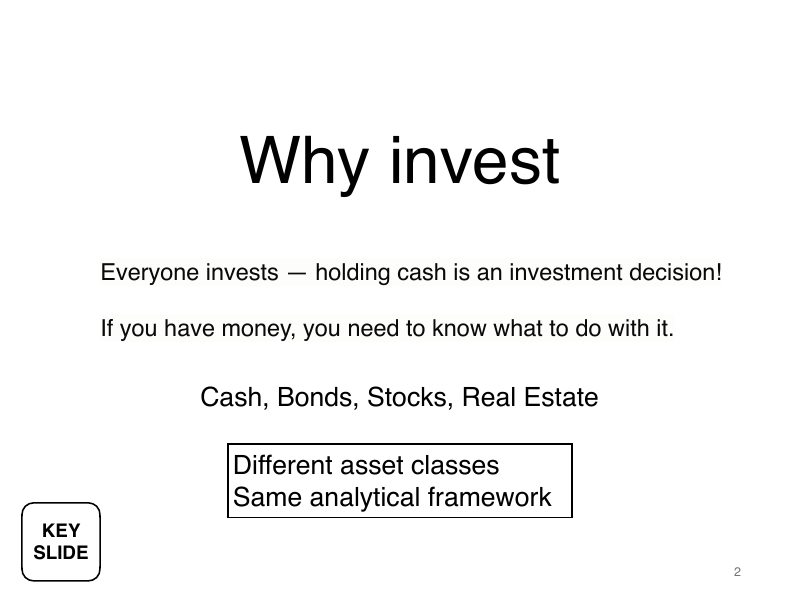
The room's first reframe — even holding cash is an investment decision. The same analytical mindset applies whether you're looking at stocks, bonds, real estate, or a savings account. The question is always: what's it worth, what does the market think it's worth, where's the gap.
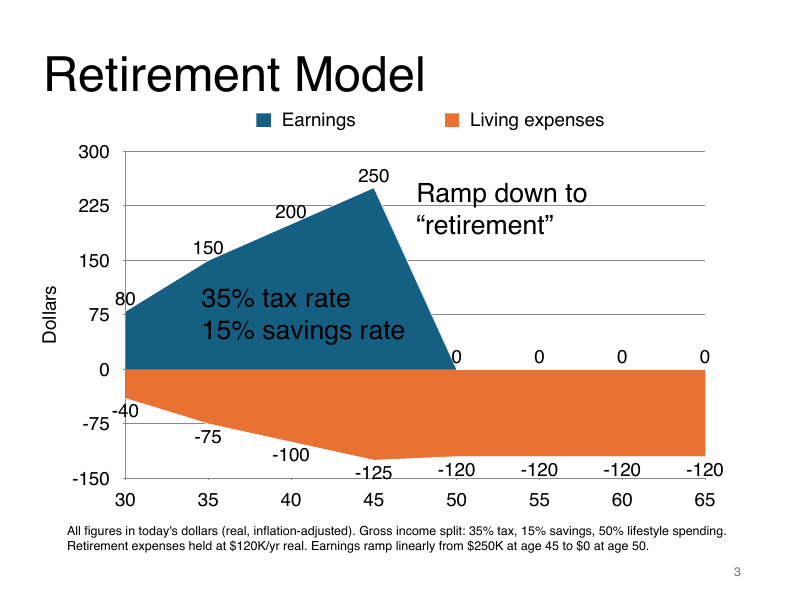
Just the assumptions, no result yet. Steven graduates and his salary ramps from $80K to $250K between age 30 and 45, then he stops earning. He saves 15% of gross, pays 35% tax, and lives on $120K/year in real terms. Everything that follows is downstream of these assumptions — and the calculator lets you change them.
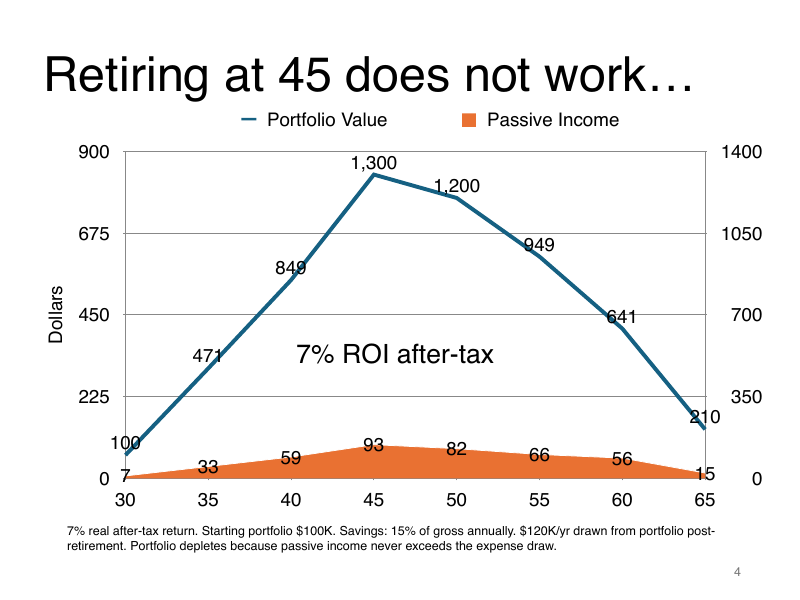
The first uncomfortable result. A reasonable index-fund return is not enough — passive income never matches the lifestyle draw, the portfolio depletes by age 70. The depletion math gets uncomfortable in the last years if you outlive your portfolio.
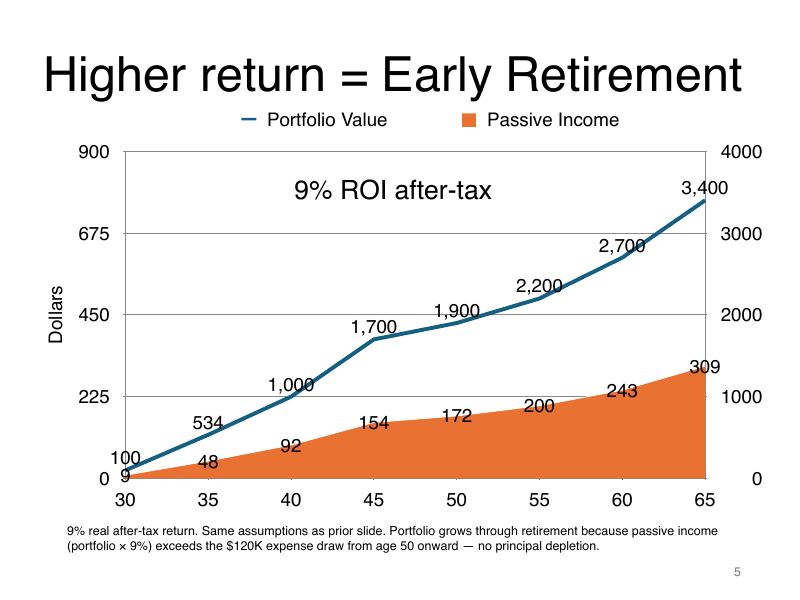
Two percentage points over 35 years is not incremental. It flips depletion into sustainable abundance: passive income exceeds expenses, the portfolio keeps growing through retirement. This is compounding's leverage on the back end: tiny return differences become enormous wealth differences.
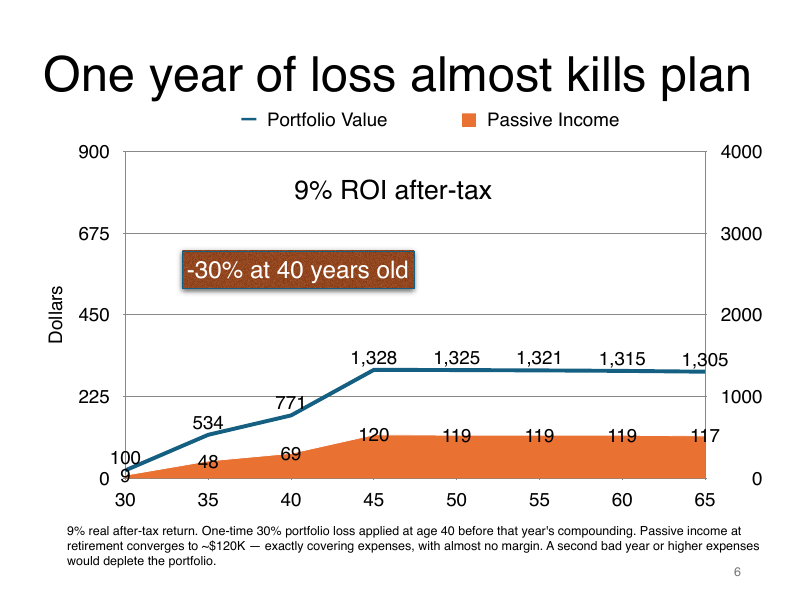
Holding the 9% return assumption but adding a single -30% year at age 40 — the entire margin disappears. Passive income exactly matches expenses for the rest of life; one more bad year and depletion begins. The headline: drawdown math is non-linear. A blow-up doesn't just hurt the year it happens, it permanently shifts every year after.
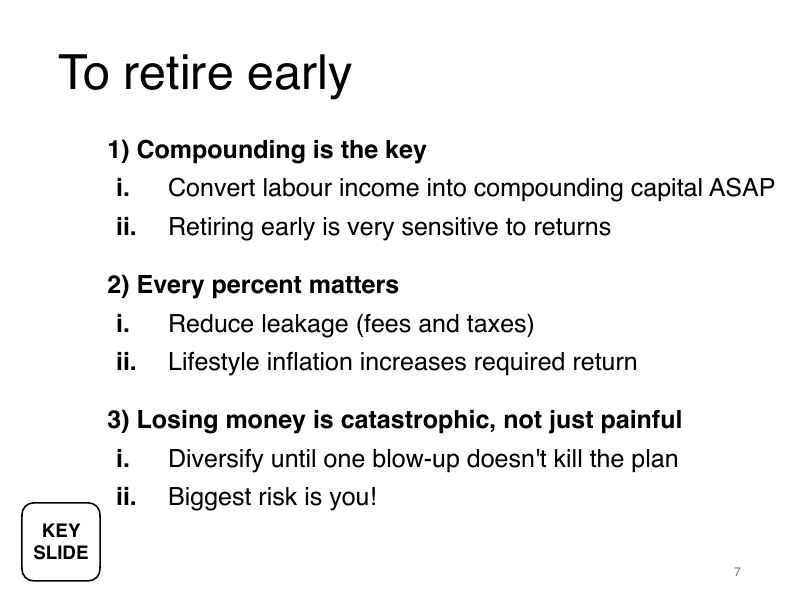
1. Compound aggressively. Convert labour income to capital fast. Time in market dominates.
2. Fight leakage. Fees, taxes, lifestyle inflation — each raises the return you need to clear.
3. Treat losses as catastrophic, not just painful. Diversify. The biggest risk to the plan is your own behavior.
Section B · Slides 8–10
Brief intro to Davis' track record as an institutional portfolio manager, then review agenda for the next 40 minutes.
Pivot slide. If you accept that compounding faster than 7% is necessary, the next question is how. The rest of the talk answers it.
Fund performance against the S&P 500. The slide existed to establish credentials for what follows, not as the point of the talk.
Five movements:
Section C · Slides 11–13
The mindset before the technical apparatus. The Value Investing page goes deeper on what each of these temperament traits looks like in practice.
Value investing is a mindset, not a formula.
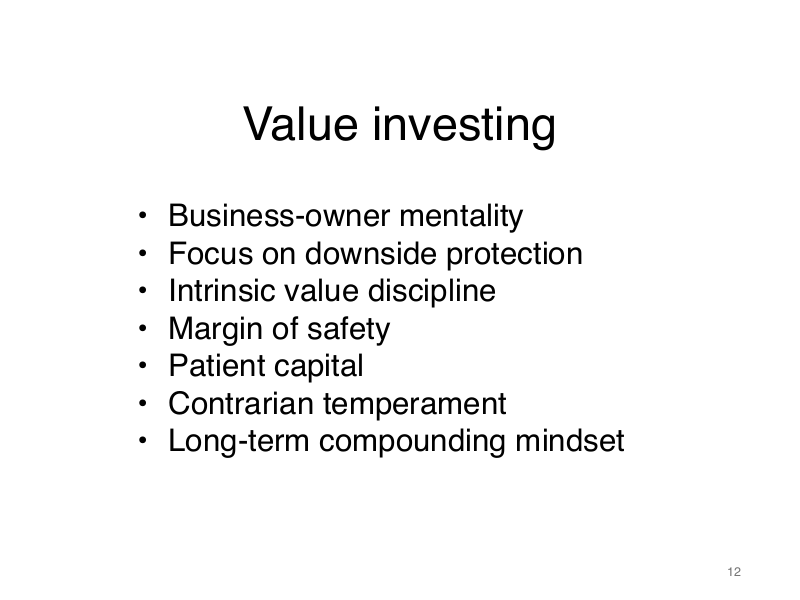
Seven traits that compound into the temperament:
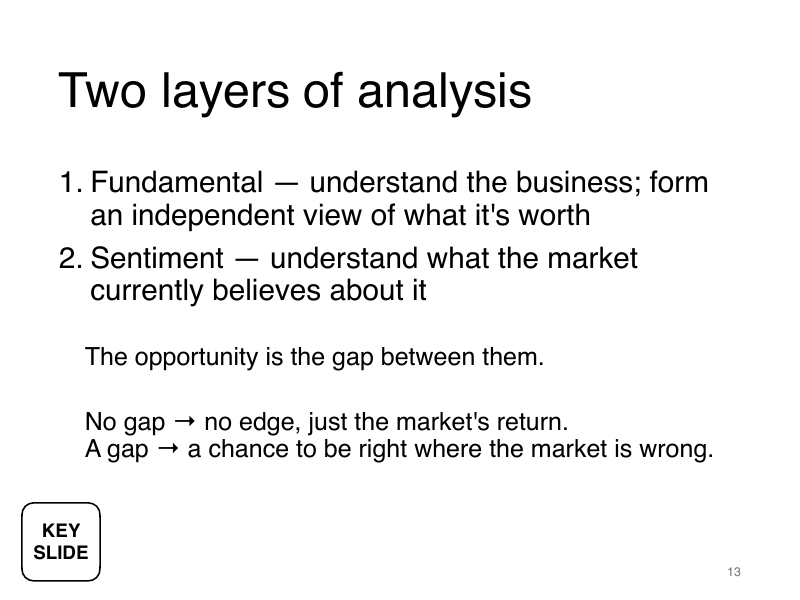
The whole framework distilled into a single idea: form your independent view (fundamentals) AND know what the market currently believes (sentiment). The gap between the two is the opportunity. No gap, no edge — you're just buying the market.
Quick example: "If you saw a $100K building in Ginza, you wouldn't assume it's terrible — you'd assume there's something to investigate." Same logic for stocks.
Section D · Slides 14–27
The technical core — three frameworks layered on each other. The Frameworks page walks each through in depth, plus the five moats and Greenwald's three-step valuation.
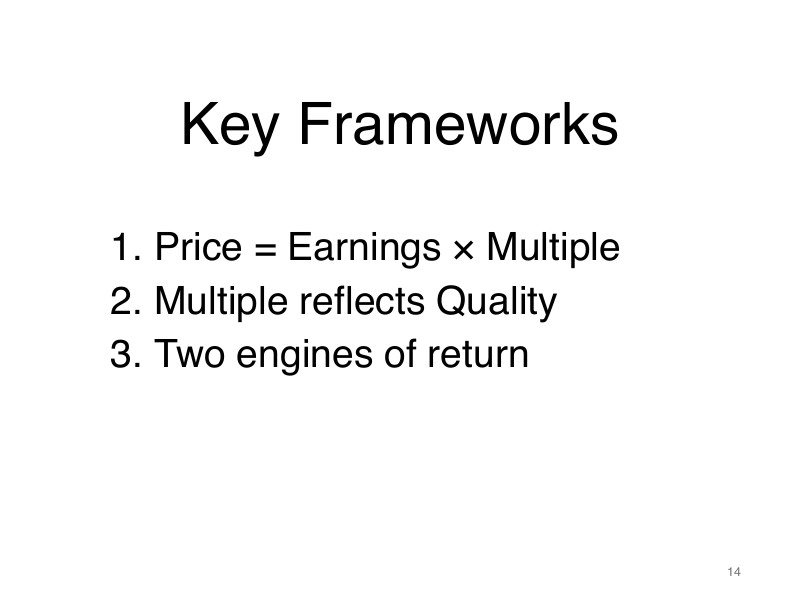
Each framework builds on the previous.
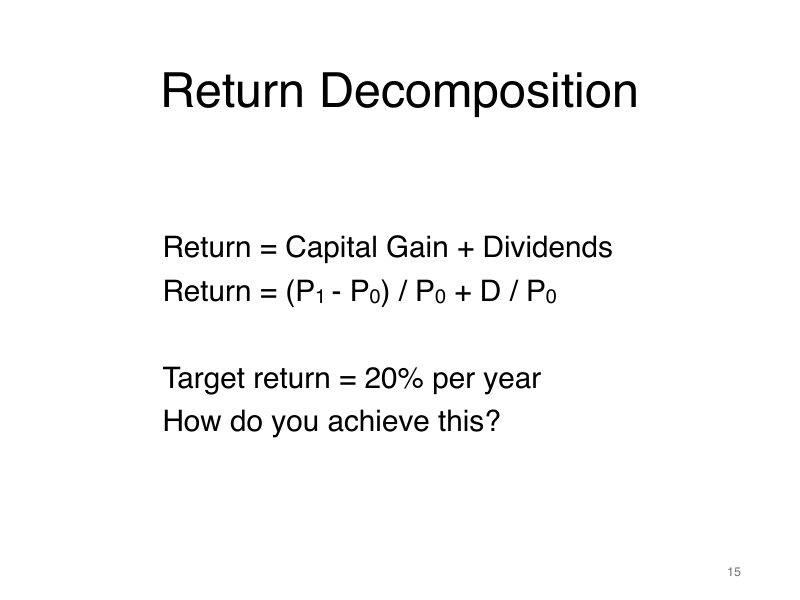
Return = capital gain + dividends. Dividends are bounded (2–5% for most companies). To earn higher than that, the capital gain component has to carry the weight — which means understanding what makes a price move.

The decomposition of price. The earnings growth trajectory of a business is generally in a "fixed path". In this example, its growth is limited for the first two years before jumping to 40% in period 4. The torque in return comes from the stock's multiple expanding from 10× to 18×. To generate above average returns, you need to understand both the earnings growth and the multiple expansion. Similarly, to avoid losses, you need to be aware of the risks associated with each component.
The intuition for multiples: "Imagine a black box paying $1/year forever. How much would you pay? Required-return 10% → 10×. Required-return 20% → 5×. The multiple is the inverse of your required return."

Pivot. If the multiple is the lever, the next question is what determines the multiple. Answer: Quality.
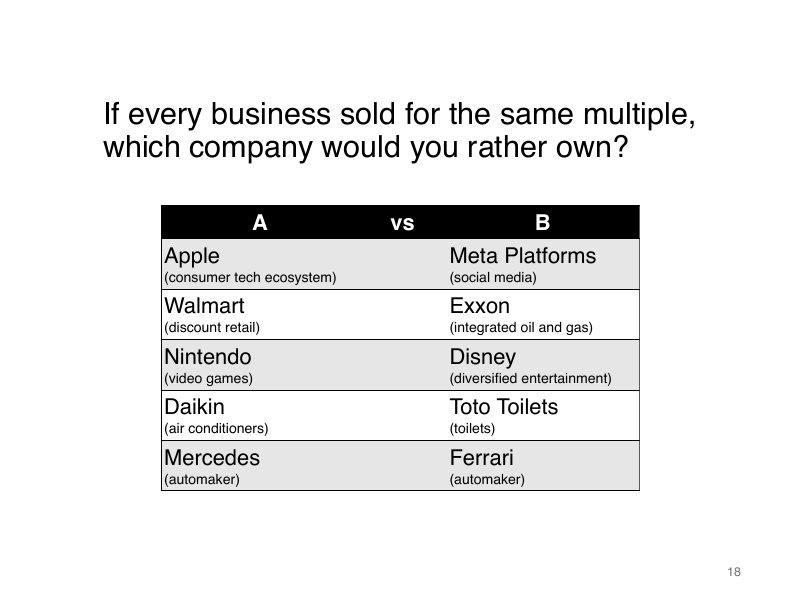
Audience exercise — five pairwise comparisons (Apple vs Meta, Walmart vs Exxon, etc.). The point wasn't a right answer; it was that everyone already has rough quality intuitions before doing any work.
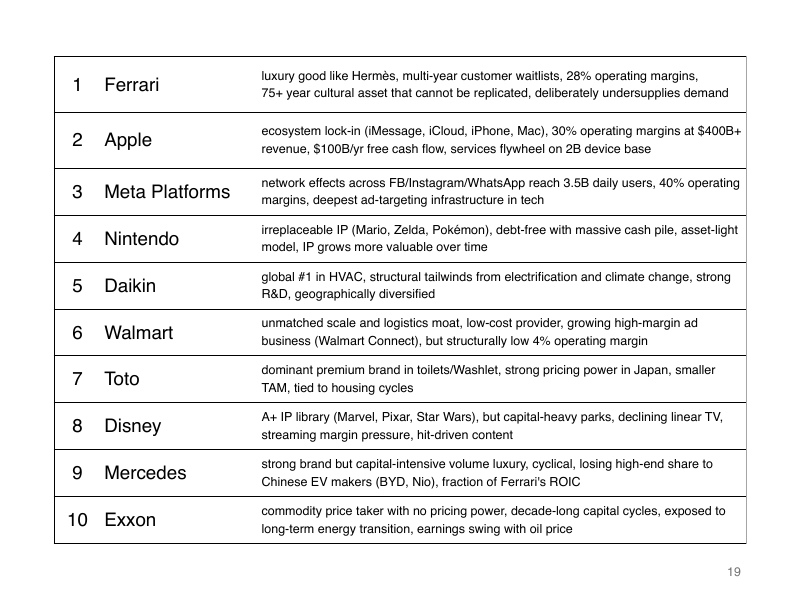
Ferrari at the top, Exxon at the bottom. The signal: pricing power and non-competing space dominate quality rankings. Companies whose moats let them charge what they want (Ferrari, Apple, Meta in their cores) earn the top spots; commodity price-takers (Exxon) earn the bottom.
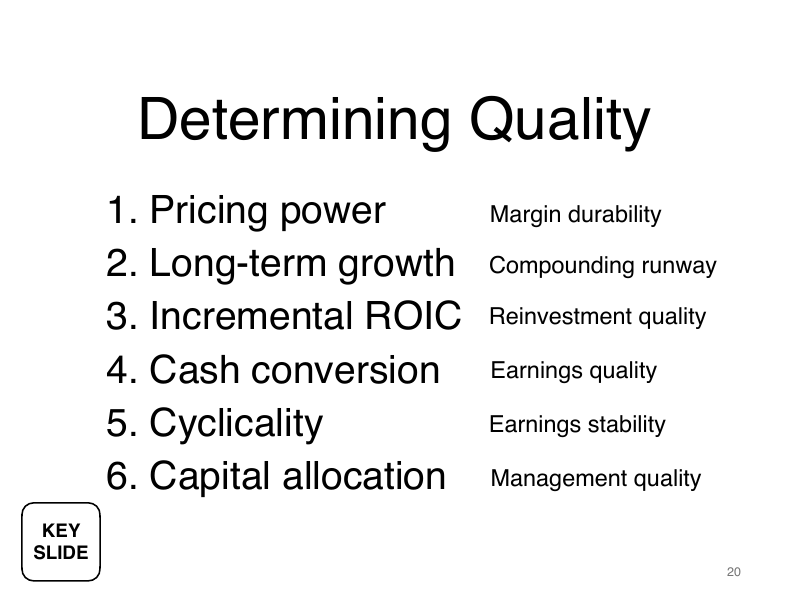
A multiple is the market's score on six dimensions: pricing power (margin durability), long-term growth (compounding runway), incremental ROIC (reinvestment quality), cash conversion (earnings quality), cyclicality (earnings stability), capital allocation (management quality). When you disagree with a multiple, you're disagreeing on one of these six.
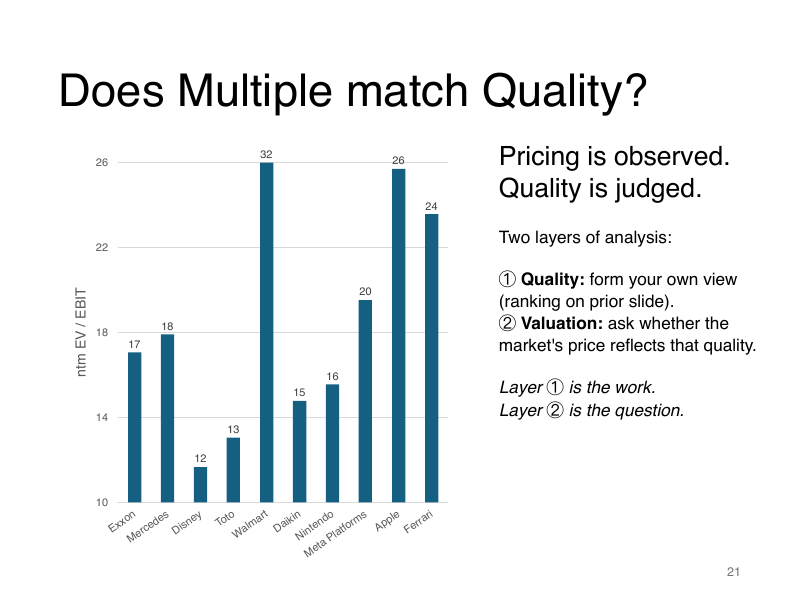
The same ten companies plotted by EV/EBIT. Pricing is observed (a fact); quality is judged (your work). The interesting cases are where the multiple and the judgment disagree.
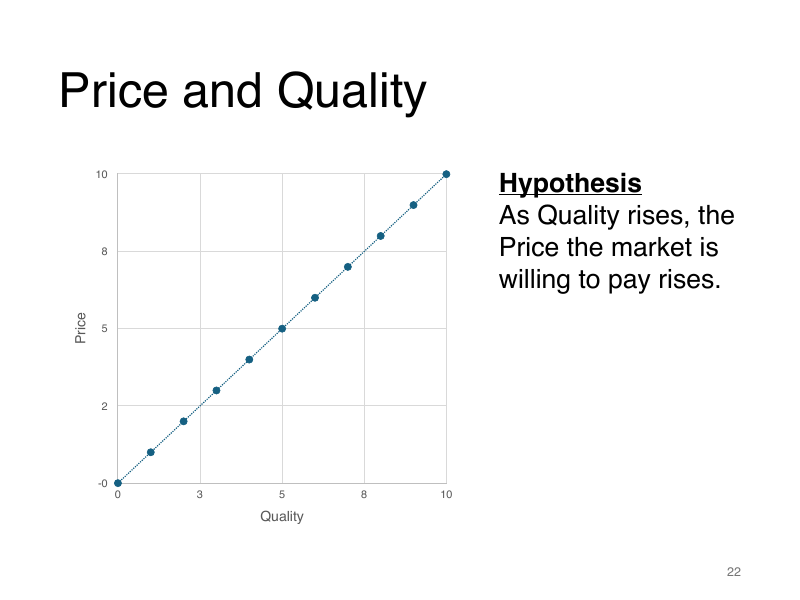
Naive view: price tracks quality on a line. True in aggregate, but it implies efficient markets — no opportunities anywhere.
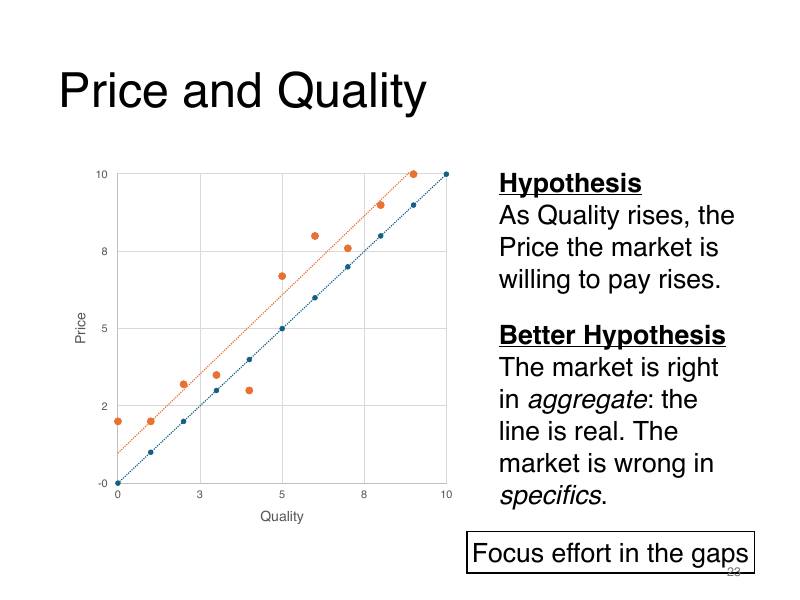
Better view: the line is real (markets are right in aggregate) but individual dots scatter (markets are wrong about specifics). Hunt the gaps where dots sit below the line. That's where you find mispricing.
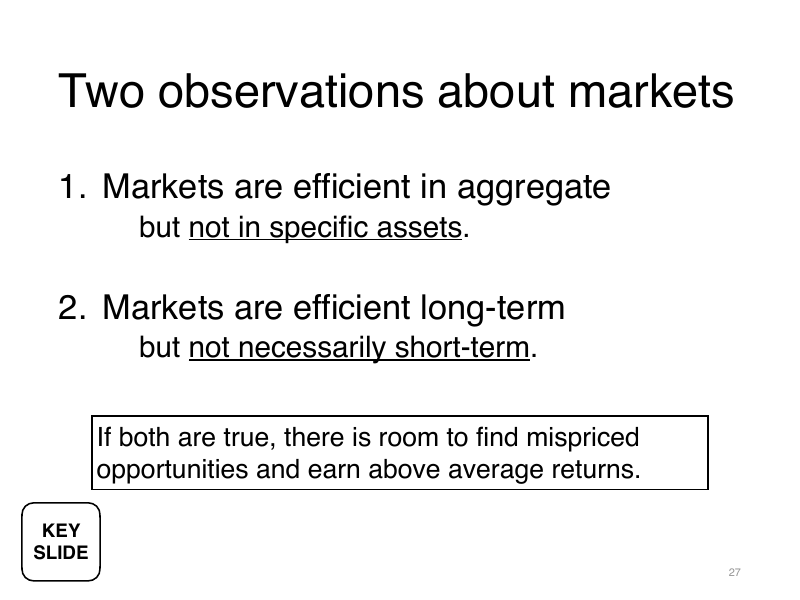
The philosophical core. Markets are efficient on the macro view and the long view, but not on the micro view and the short view. To earn above average returns, you must identify the gaps where the market is wrong.
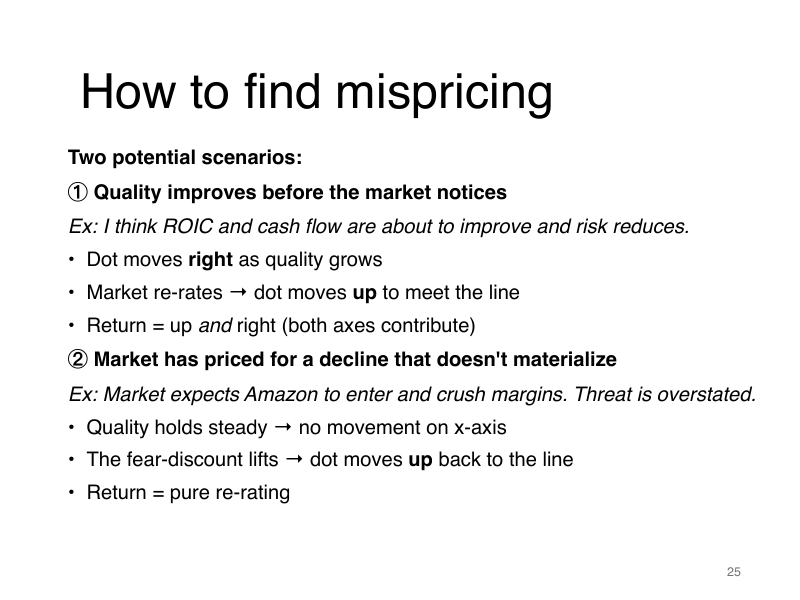
Two distinct setups. (1) Quality is improving before the market notices — you ride both the earnings growth AND the re-rating. (2) Fear is over-priced and the predicted decline doesn't materialize — you ride a pure re-rating. The Meta example in Section F is type 2.
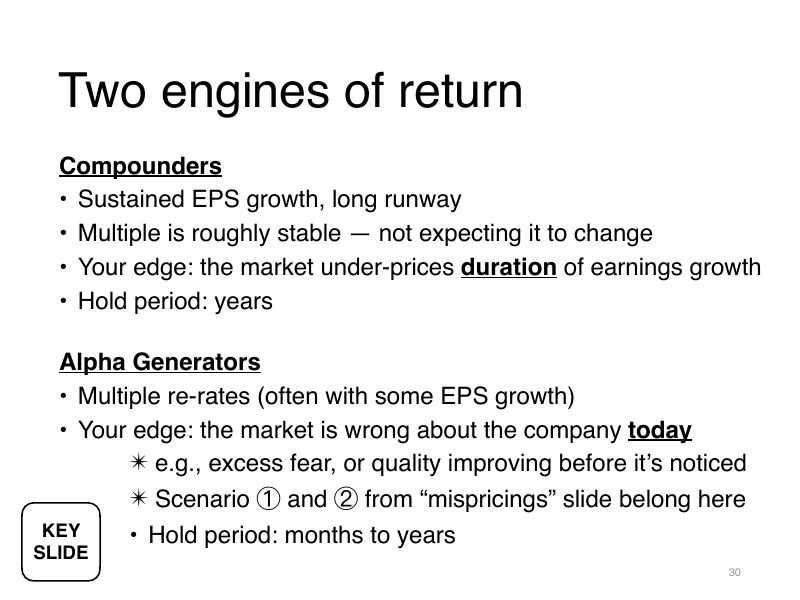
Compounders — bet that the market under-estimates how long a high-quality business can grow. Hold for years. Multiple stable; return comes from earnings growth duration.
Alpha generators — bet that the market is wrong about the company today. Hold months to years. Return comes from the multiple re-rating, often alongside some earnings growth.
Different timeframes, different edges. The two can run in parallel; they sit in different parts of the portfolio.
Section E · Slides 28–35
How to actually do the work. The Research page breaks each stage into its own deep-dive.

Pivot to the operational stage. The frameworks are abstract; the process is concrete.
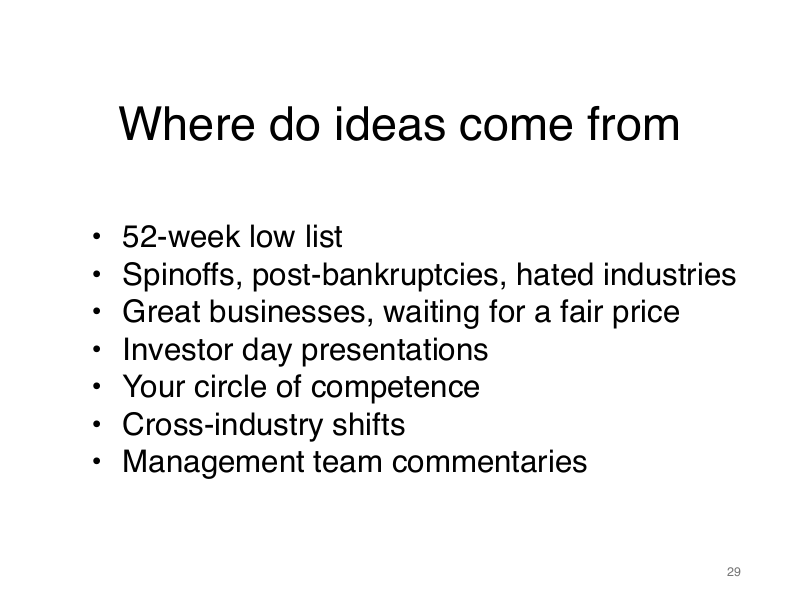
Seven sources. Some in places others aren't looking: 52-week lows, spinoffs, hated industries, cross-industry shifts. But also some places where you can find good information: investor-day presentations and management commentaries.
The metaphor in the room: "If you see onions on sale 50% off, do you walk past assuming they're rotten? Or do you check? Maybe only 10% is bad and you cut it off: pay 50% for 90% of an onion!"
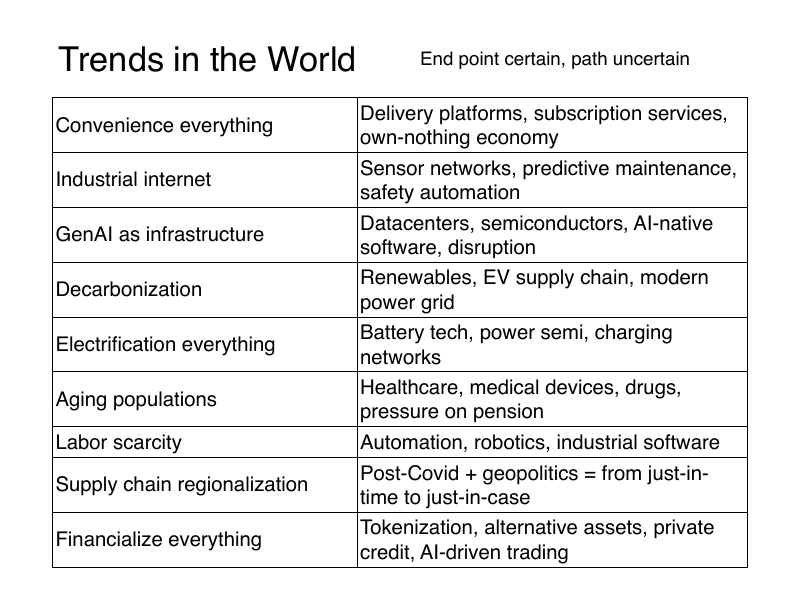
Tailwinds, not theses. Most endpoints are knowable; the paths to them are not. The trend list is for biasing idea generation, not substituting for it. A trend tells you which industries to look in; the work of finding the mispriced names inside them still has to happen one company at a time.
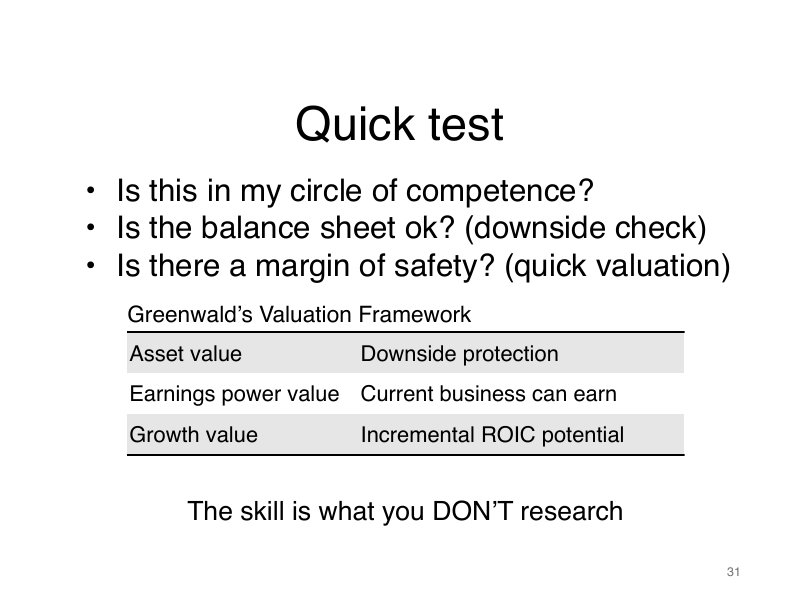
Three filters before spending real time. If any answer is no, kill the idea and move on. Greenwald's valuation framework is introduced; full discussion in the Frameworks → Greenwald 3-step section. The skill is choosing what NOT to research.
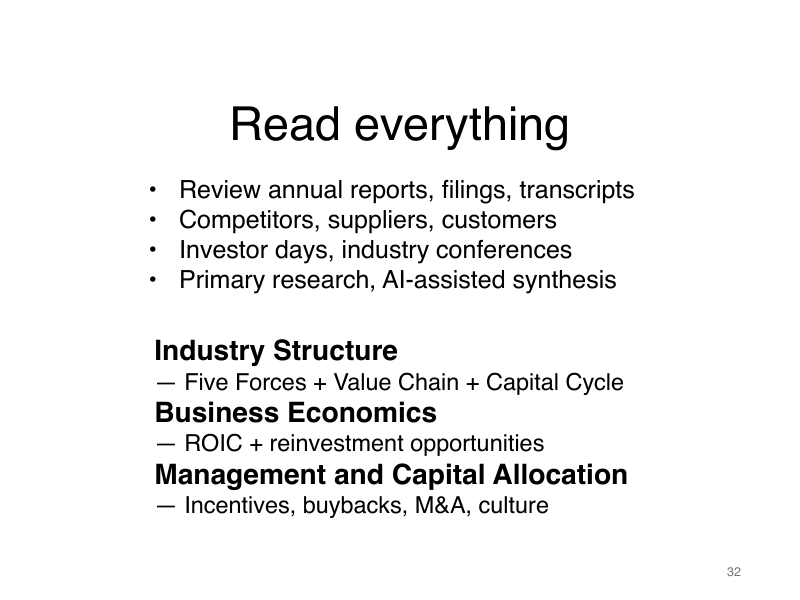
Read everything to help you understand these three key areas:
Primary sources beat secondary; AI accelerates the secondary but doesn't replace the primary.
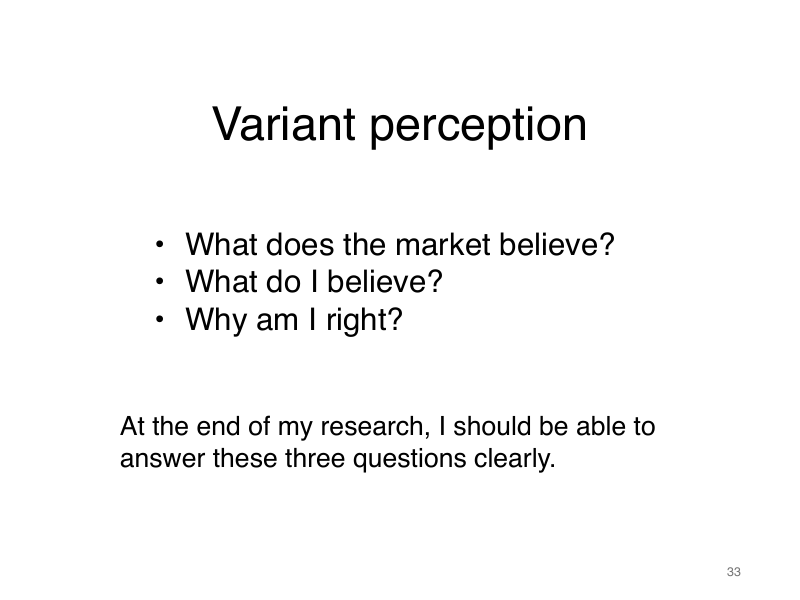
The diagnostic at research-end: can you answer three things clearly?
If any answer is fuzzy, your edge is fuzzy.
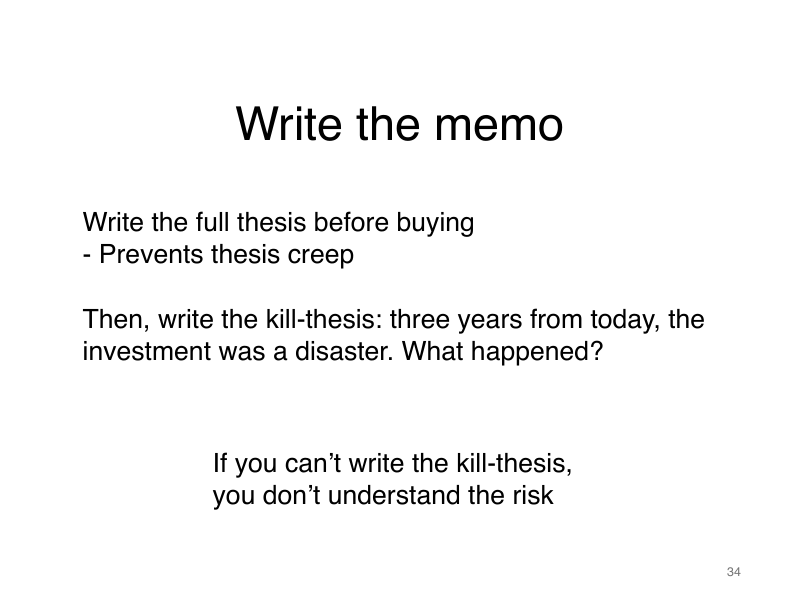
Write the full thesis before buying — prevents thesis creep after the fact.
Write the kill-thesis: three years from today, this was a disaster. What happened? If you can't write that, you don't understand the risk.
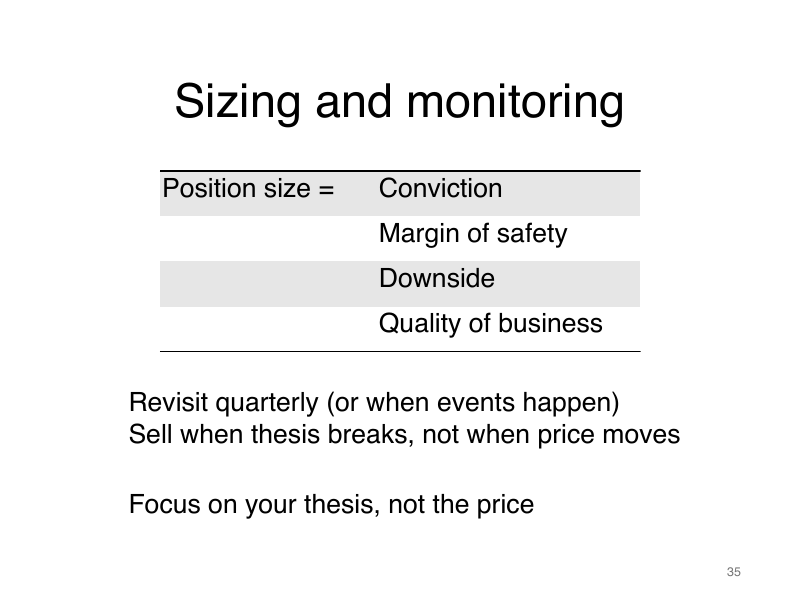
Position size is a function of conviction, margin of safety, downside, quality. Revisit quarterly or on events.
The discipline: sell when the thesis breaks, not when the price moves. Focus on the thesis, not the tape.
Section F · Slides 36–44
The whole framework applied to one trade: Meta's -75% drawdown in 2022 and the subsequent 6x recovery. The Frameworks page walks the full essay; here are the slides in order.
The framework was abstract; this is what it looked like on a real, messy, public trade in one of the largest companies on earth.
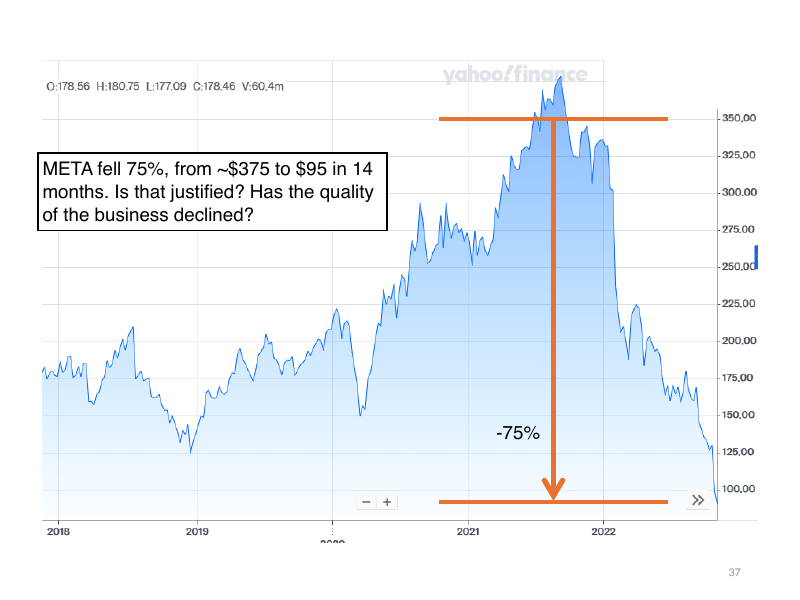
The setup. From ~$375 to ~$95 in 14 months. Three-quarters of market cap erased on the largest social network on the planet. The only question worth asking: did the quality of the business actually decline, or did the price overreact?
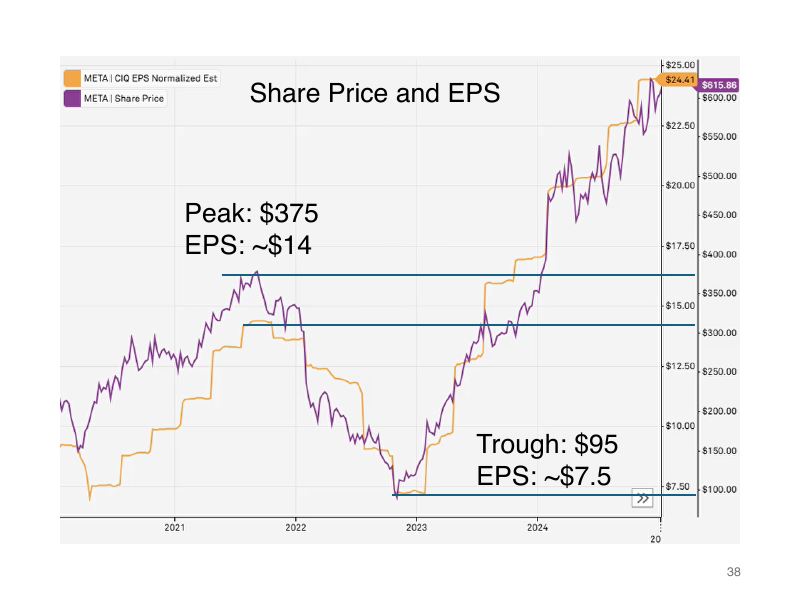
Decomposing the fall. Earnings fell roughly -46%, but the price fell -75%. The extra drop is the multiple changing.
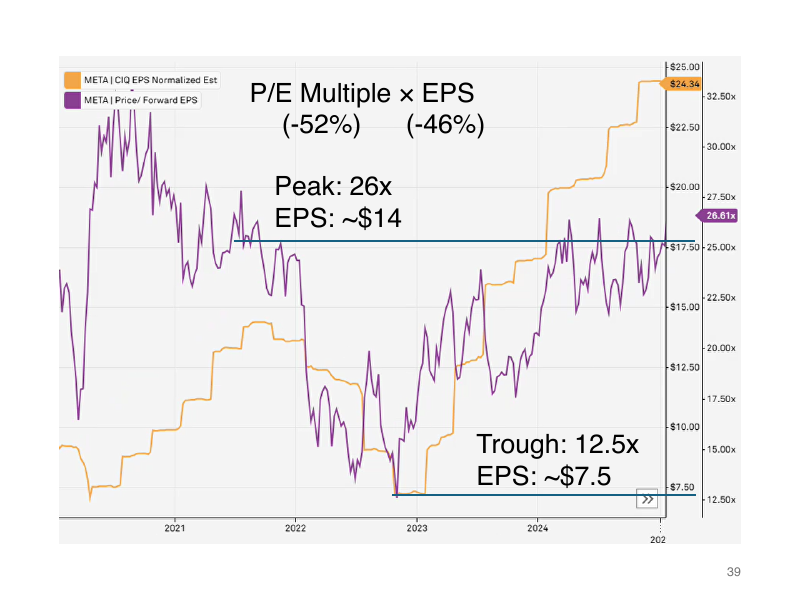
The multiple compressed from 26× to 12.5× — roughly -52%. Combined with the -46% earnings fall, that gets you to -75% price.
Most of the drawdown was the multiple. Which means most of the recovery had room to be a pure re-rating, before any earnings work happened.
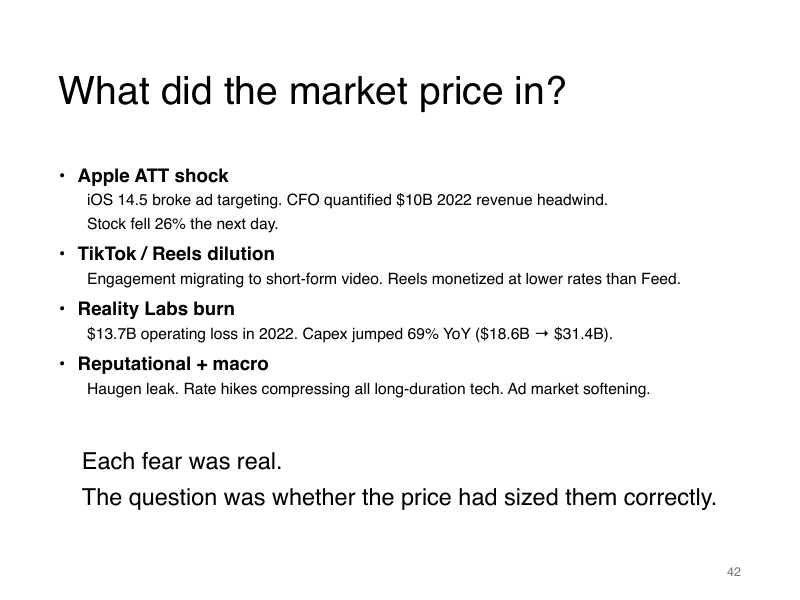
Four real fears: Apple's ATT breaking ad targeting ($10B headwind); TikTok taking time-share with Reels monetized below Feed; Reality Labs burning $13.7B with capex spiking; reputational issues plus rate hikes compressing all long-duration tech. Each fear was real. The question was whether the total discount was sized correctly.
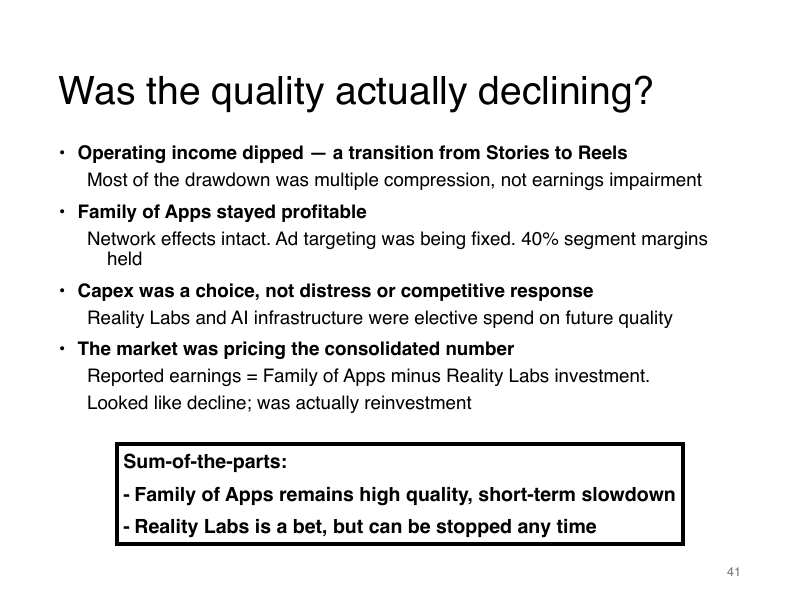
Sum-of-the-parts unbundles the story. Family of Apps held its 40% segment margins; network effects intact; ad targeting was being fixed. Capex wasn't distress — it was elective spend on future quality. The market was pricing the consolidated number (FoA minus Reality Labs); what looked like decline, was actually reinvestment.
The variant-perception moment: "My friends were on TikTok but sharing the videos back to me on Instagram. Consuming on TikTok, but producing content on Instagram. The network-effect moat holds."
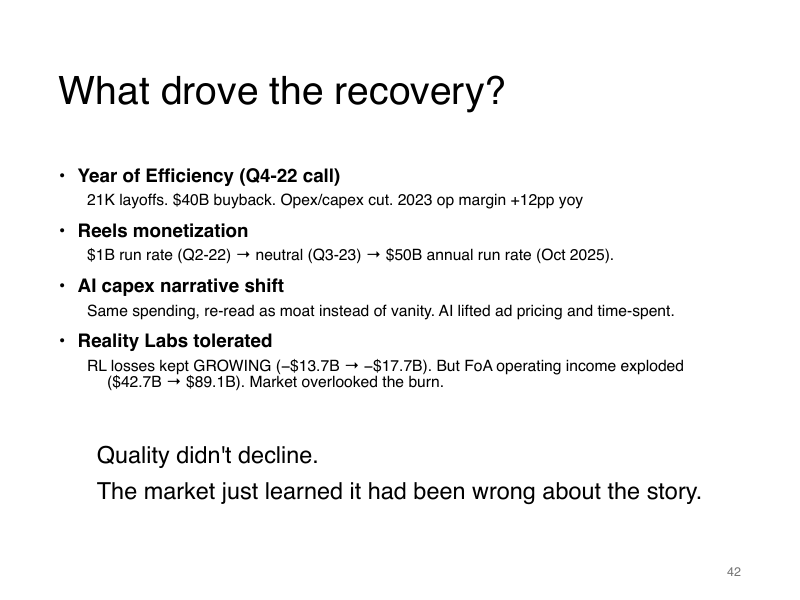
Four catalysts converged: the Q4-22 "Year of Efficiency" announcement (21K layoffs, $40B buyback); Reels monetizing from $1B run-rate to $50B over three years; AI capex re-read as moat instead of vanity; Reality Labs tolerated as long as the core kept growing. Quality didn't change; the market's story about quality did.
This was Scenario 2 from slide 25: the quality of the business was intact (stable, and possibly rising). The multiple recovered with an earnings rebound.
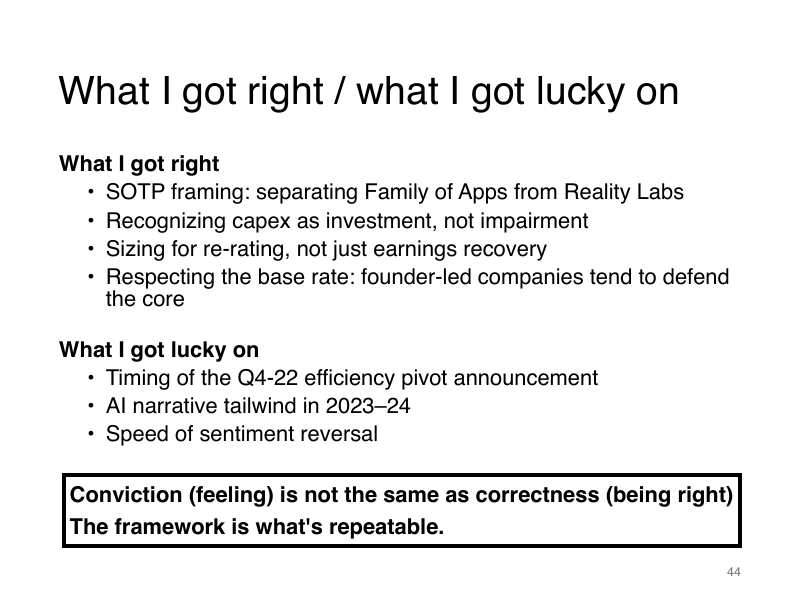
Repeatable (the framework): SOTP framing, recognizing capex as investment, quality assessment suggests re-rating, respecting the founder-led base rate.
Not repeatable (the luck): exact timing of the efficiency pivot, the AI tailwind, the speed of sentiment reversal.
Conviction is not the same as correctness. The framework is what generalizes.
Section G · Slides 45–50
Generalizing past Meta. Mispricings happen all the time, on both short and long timescales.
Closing examples.
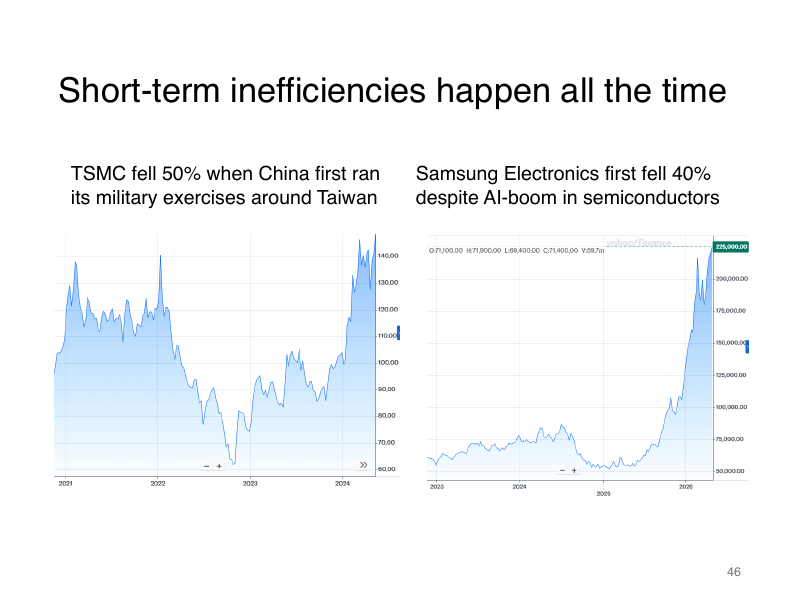
TSMC fell 50% on Taiwan-invasion fear; Samsung fell 40% during the AI boom because they couldn't qualify their HBM memory yet. Asymmetric pricing of the same risk across the same supply chain (Taiwan) is the inefficiency in the TSMC case. If China actually invaded, every tech company would fall, not just one.
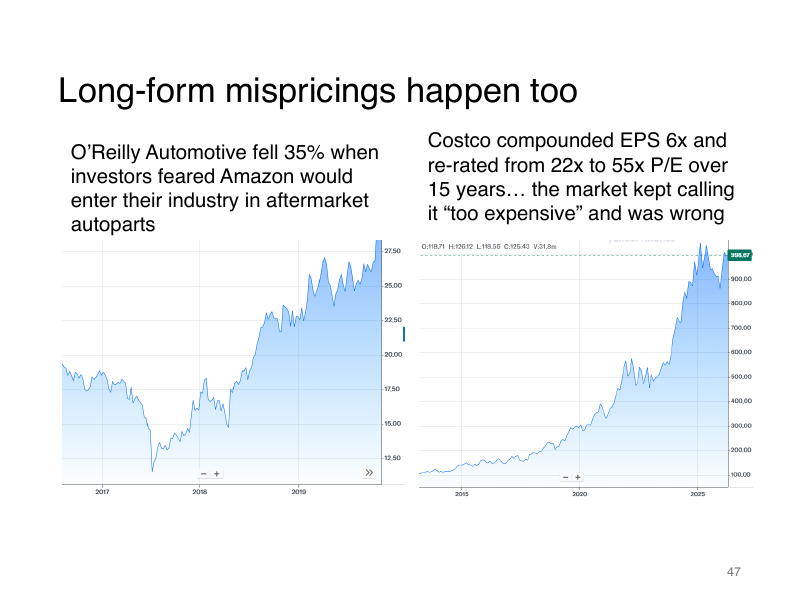
O'Reilly held its moat against Amazon-entry fear (the relationships with mechanics didn't dissolve). Costco compounded EPS 6× and re-rated 22× → 55× over 15 years while the market kept calling it expensive. Long arcs of being right are also opportunities. They just require patience.
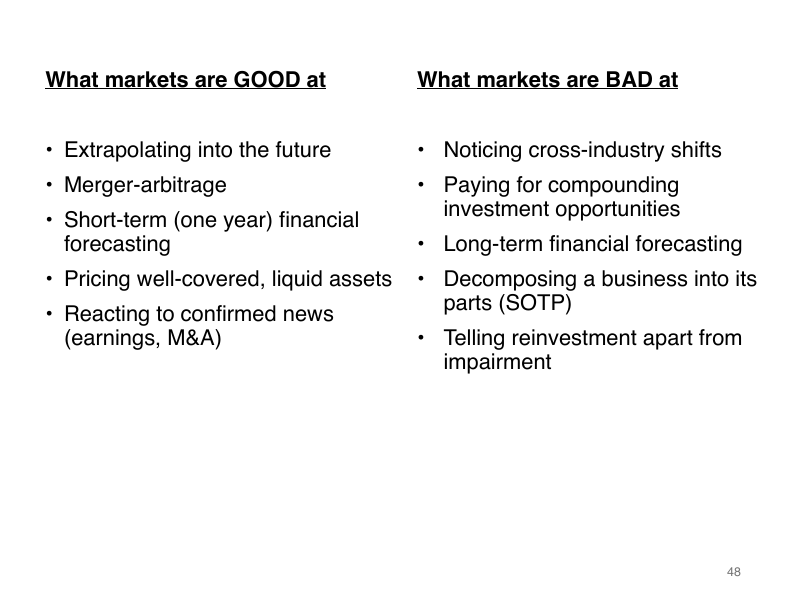
Markets are good at the things you'd expect: extrapolation, merger arb, short-horizon forecasts, well-covered liquid names, reacting to confirmed news.
They're bad at cross-industry shifts, paying for compounder duration, long-horizon forecasts, decomposing a business (SOTP), and telling reinvestment apart from impairment.
The "bad at" list is where there's more opportunity for above average returns.

Thank you for your attention!